
The Receipt
The Raise That Couldn't Keep Up
Since 2019, Social Security COLA increases have trailed food-at-home inflation by 6.6 percentage points.
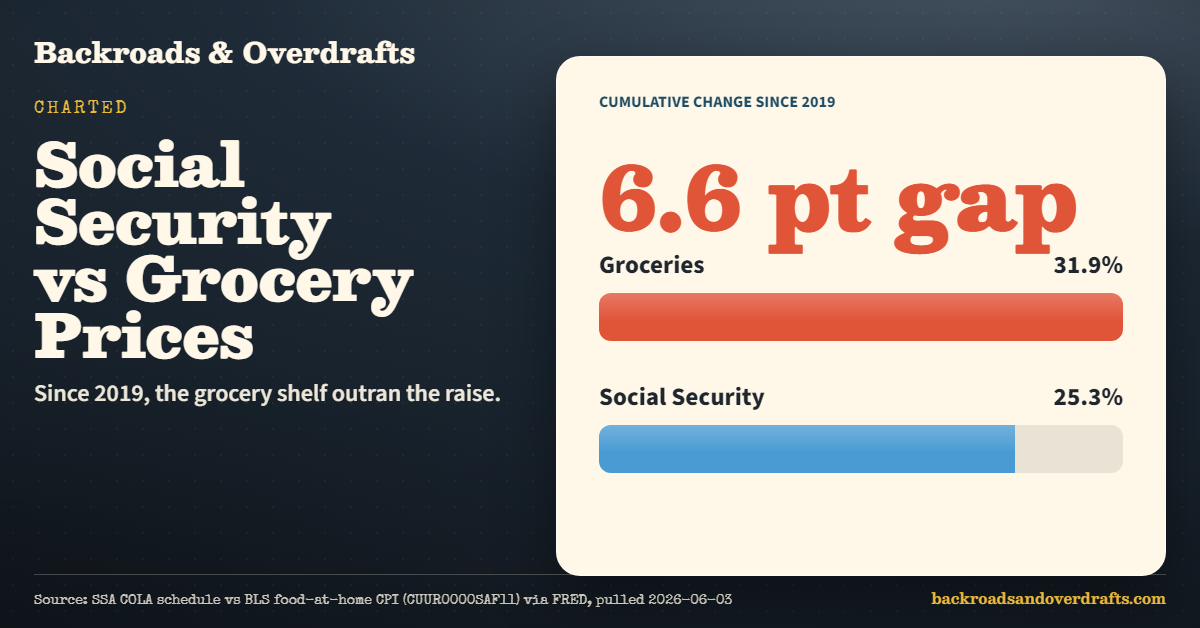
If you have heard someone on a fixed income say the raise did not feel like a raise, this is the chart behind that sentence.
According to the Social Security Administration, since 2019 cost-of-living adjustments compounded to 25.3%. Over roughly the same window, food-at-home prices tracked by the U.S. Bureau of Labor Statistics rose 31.9%.
That leaves a 6.6 percentage point gap between the check and the grocery shelf.
The Receipt
| Measure | Cumulative change |
|---|---|
| Social Security COLA since 2019 | +25.3% |
| Food-at-home CPI | +31.9% |
| Gap | 6.6 percentage points |
That gap is why grocery talk hits differently for people who cannot just pick up more hours, change jobs, or wait for a bonus.
The Caveat
COLA is not designed to track groceries alone. Social Security COLA is based on a broader inflation measure, while this chart compares it to food-at-home prices specifically. Rent, medicine, utilities, insurance, and local prices can tell a different story for any one household.
But groceries are the receipt people see over and over. When that receipt outruns the raise, the squeeze is not hard to understand.
If you live on a fixed income, what bill feels like it moved the fastest?
How to read the gap at home
This is not a retirement-planning article. It is a receipt check. The useful move is to separate the bills that move with official inflation from the bills that move in your own kitchen.
| Budget line | Why it matters | What to check |
|---|---|---|
| Groceries | The chart uses food-at-home CPI because this is the receipt people keep seeing. | Compare your last four grocery trips, not one weird week. |
| Utilities | COLA does not know whether your electric rate changed or your house leaks heat. | Look at kWh used and rate per kWh separately. |
| Medicine and insurance | These can move differently from food, especially by plan and state. | Keep renewal notices beside grocery receipts. |
If you are helping a parent or neighbor, this table is the conversation starter. Do not ask whether they are “budgeting better.” Ask which line moved faster than the check.
Useful source trail: the named entities here are the Social Security Administration for COLA, the Bureau of Labor Statistics for consumer price indexes, and FRED as the public series host for many economic time series.
Keep going
If this price check hit the same nerve as your last grocery run, A Bag of Starbucks Costs How Much Now? keeps the receipt math going.
For a cheaper table-level fix, How the House Got Out of Reach turns the same pressure into dinner.
And when you want a break from the numbers, How Your Coffee Quietly Doubled is the kind of small outing that still works.
Sources: Social Security Administration COLA history and BLS food-at-home CPI via FRED. Snapshot compares cumulative COLA raises since 2019 with food-at-home CPI through April 2026. Pulled 2026-05-31.
Keep reading
More from The Receipt
 The Receipt
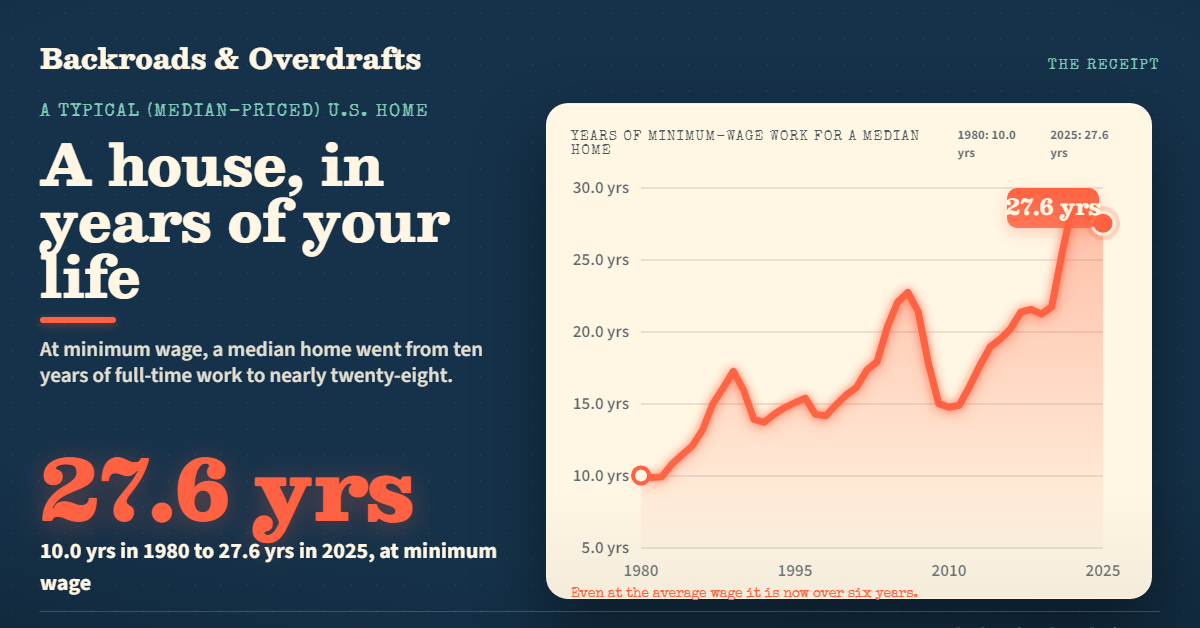
A House Used to Cost 4 Years of Work. Now It Is Closer to 6 and a Half.
Measured in years of full-time work instead of dollars, a typical American home went from about 4.5 years of the average wage in 1980 to 6.4 today, and from 10 years to nearly 28 at minimum wage. The median price climbed from $64,750 to $415,400.
 The Receipt
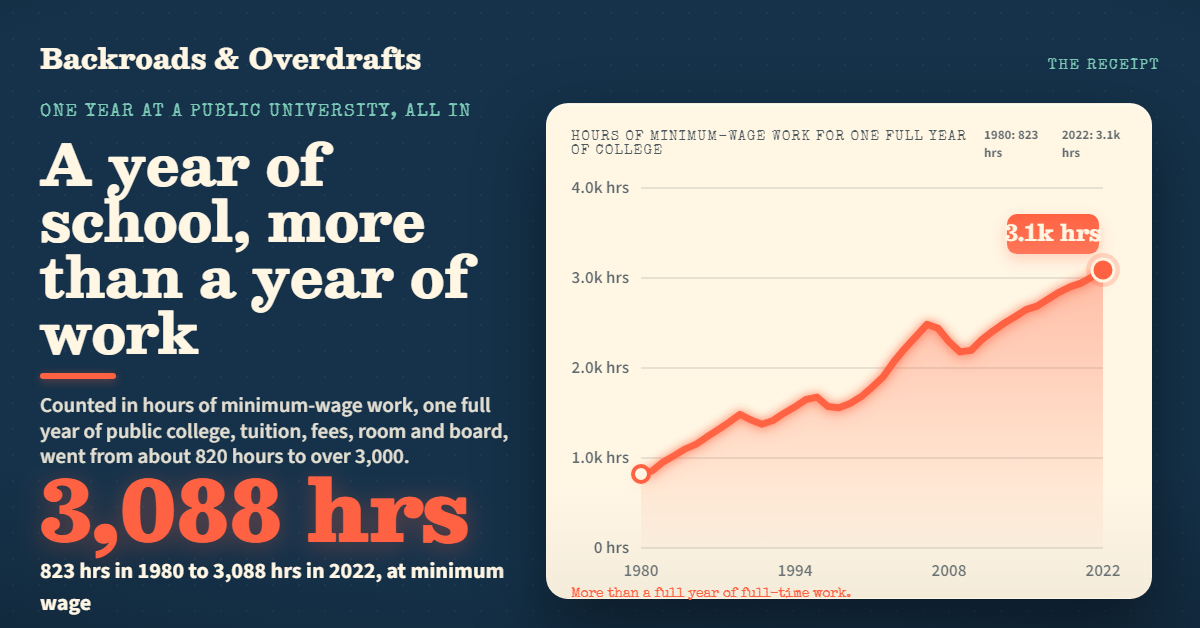
A Year of College Now Costs More Than a Year of Work
Add up everything one year at a public university actually costs, tuition, fees, room and board, and price it in hours of work. It went from about 820 hours of minimum-wage work in 1980 to over 3,000 today. The bill climbed from $2,550 to $22,389.
 The Receipt
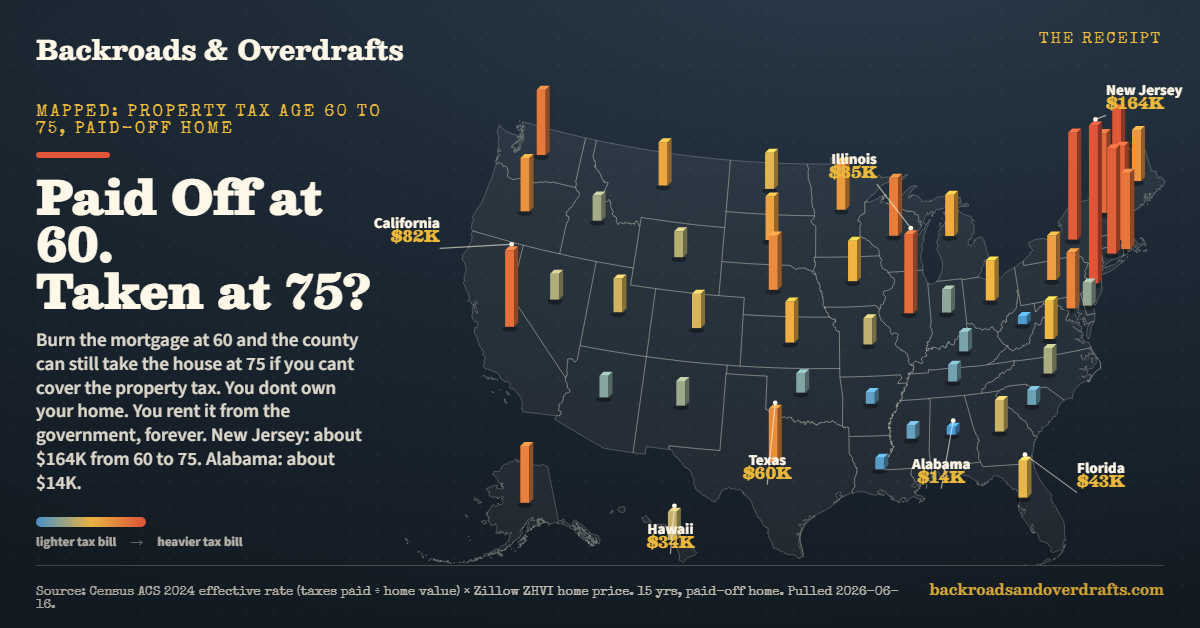
The House Is Paid Off. The Tax Never Is.
Pay off your mortgage at 60 and the county still bills you every year. We mapped what 15 years of property tax costs on a paid-off home in all 50 states. New Jersey, about $164,000. Alabama, about $14,000.