
The Receipt
A House Used to Cost 4 Years of Work. Now It Is Closer to 6 and a Half.
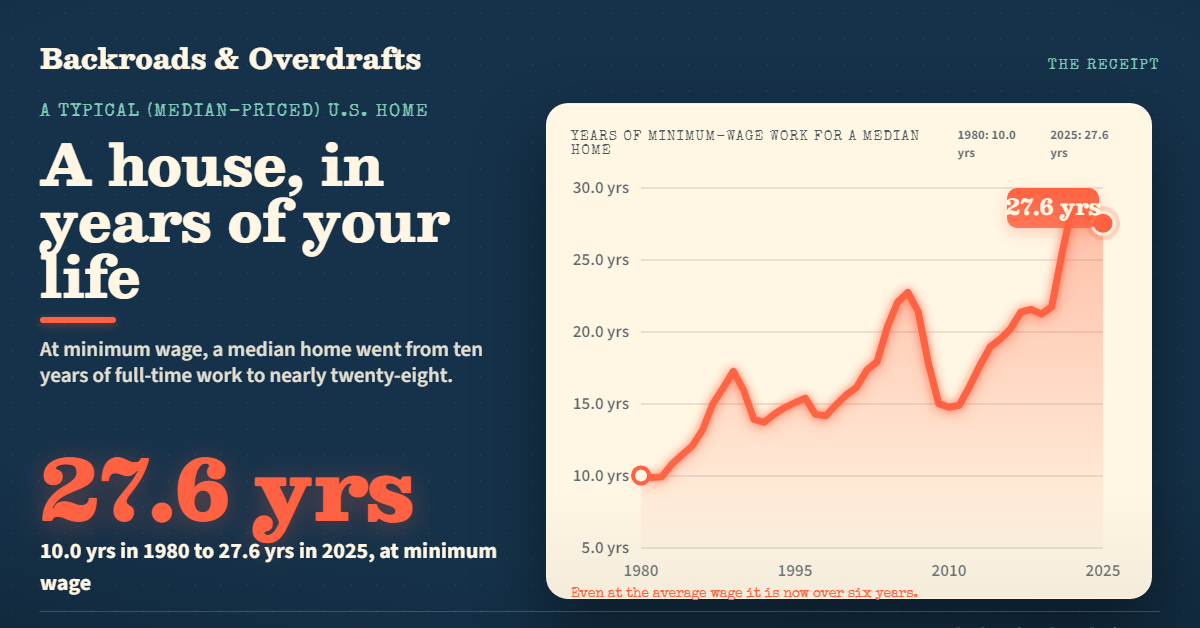
Measured in years of full-time work instead of dollars, a typical American home went from about 4.5 years of the average wage in 1980 to 6.4 today, and from 10 years to nearly 28 at minimum wage. The median price climbed from $64,750 to $415,400.
There is a number that gets thrown around in every housing argument, and it is always a dollar figure. The median house costs $400,000-something now. It cost $60,000-something in 1980. One side says that proves the market is broken, the other says you have to adjust for inflation and wages, and everybody talks past everybody else.
So let us settle it in a unit nobody can argue with. Forget dollars. How many years of your working life does a house cost?
How we turned a price into years
We took the median sales price of an American home for every year from 1980 to 2025, straight from federal data, and divided it by a full year of full-time work, 2,080 hours, at two different wages: the average wage for a typical worker, and the federal minimum wage. That gives you the rawest possible affordability number. Not a monthly payment, not a mortgage with rates and tax breaks folded in, just the blunt question: if every single dollar you earned went to the house and nothing else, how many years would it take to buy it outright?
It is not how anyone actually buys a home. But it is the cleanest way to compare 1980 to today, because it strips out interest rates and lending rules and leaves only the price against the paycheck.
The part that is smaller than you would expect
Start with the average wage, because the answer surprises people who expect pure doom.
In 1980, the median home cost a typical worker about 4.5 years of full pay. In 2025, it costs about 6.4 years. That is a real jump, roughly 40 percent more of your working life, but it is not the 10x horror story the raw price tags suggest. The reason is simple: wages went up too. The median price climbed from about $64,750 to $415,400, more than sixfold, but the hourly wage rose alongside it, so measured in work-years the climb is steeper than coffee and gentler than the sticker shock implies.
That is the honest half of the story, and it is worth saying out loud because it is the half nobody posts. At an average wage, a house got harder, not impossible.
The part that is worse than you think
Now run it at the bottom of the ladder, and the floor drops out.
At the federal minimum wage, a median home went from about 10 years of full-time work in 1980 to nearly 28 years in 2025. Twenty-eight years. That is a working lifetime, every hour of it, with nothing spent on rent, food, or a single day off, just to cover the price of a typical house once.
| Year | Median home price | At minimum wage | At the average wage |
|---|---|---|---|
| 1980 | $64,750 | 10.0 years | 4.5 years |
| 1990 | $122,300 | 15.9 years | 5.8 years |
| 2000 | $167,550 | 15.6 years | 5.8 years |
| 2010 | $222,700 | 14.8 years | 5.6 years |
| 2025 | $415,400 | 27.6 years | 6.4 years |
Notice the minimum-wage line actually dips through the 2000s. That is not a glitch. The federal minimum wage stepped up from $5.15 to $7.25 between 2007 and 2009, which briefly bought back some ground even as prices rose, before the line resumed its climb. The average-wage line, meanwhile, barely moved for thirty years and then jumped after 2020, which is exactly when “I can never afford a house” went from a complaint to a generational mood.
The caveats, because they matter
This is a price-to-one-wage number, and it is deliberately blunt, so a few honest notes:
- It is one earner. A lot of homes are bought on two incomes, which roughly halves the years. The single-wage figure is the gut check, not the mortgage application.
- It ignores mortgages and rates. Nobody pays cash. The actual monthly burden depends on interest rates, down payment, and taxes, which is its own separate pain.
- The minimum-wage line is illustrative. Very few people buying homes earn minimum wage. The point of that line is the scale of the gap, not a literal home-buying plan.
What the work-years number captures that a monthly payment hides is the raw distance between what a house costs and what an hour of labor is worth. And that distance grew, at every wage, in every decade.
What it means when you are the one priced out
If the math feels personal, it is because it is. The useful takeaways are not cheerful, but they are real:
- Two incomes is now the baseline assumption, not a bonus. The single-earner house your parents bought is, at the average wage, a roughly six-and-a-half-year commitment of one person’s entire pay. The market quietly repriced around dual income.
- Where you buy changes everything. That $415,400 is a national median. The work-years math swings wildly by metro, which is why so many people are moving for the same paycheck.
- The years are the honest budget. Before a lender tells you what you can “afford” at a given rate, the work-years number tells you what you are actually signing up for: a chunk of your working life, priced against a wage that did not keep up.
The house did not just get more expensive. It got more expensive measured in the one thing you cannot make more of, which is time. That is the number worth keeping in your head the next time someone says wages have kept up with prices.
We measure a lot of things in hours and years of work instead of dollars. See what a year of college costs in work hours, home prices against household income, and how many minutes of work a pound of groceries takes now.
Check the raw data yourself: the median sales price of U.S. homes is on FRED (MSPUS), and the wage series are the typical-worker wage and the federal minimum wage.
Sources: median sales price of houses sold in the United States from FRED (MSPUS), annual averages. Wages from FRED: Average Hourly Earnings of Production and Nonsupervisory Employees (AHETPI) and the federal minimum wage (FEDMINNFRWG). Years of work = price divided by a full year of work (2,080 hours) at each wage, pre-tax. 1980 through 2025. Pulled 2026-06-16.
Keep reading
More from The Receipt
 The Receipt
A Year of College Now Costs More Than a Year of Work
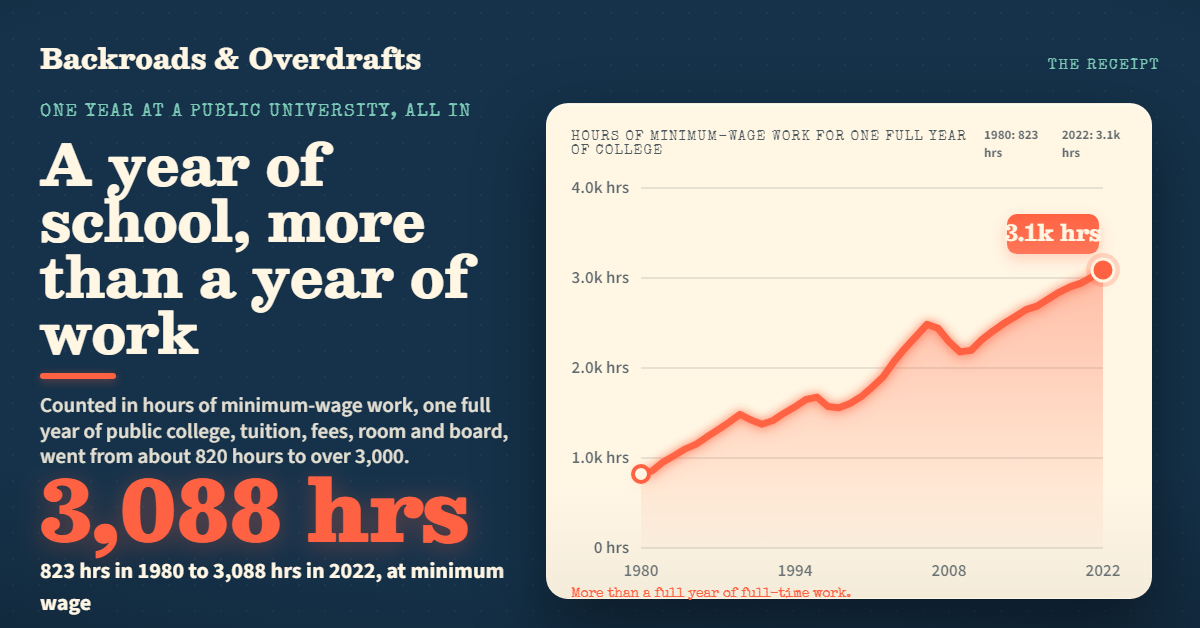
Add up everything one year at a public university actually costs, tuition, fees, room and board, and price it in hours of work. It went from about 820 hours of minimum-wage work in 1980 to over 3,000 today. The bill climbed from $2,550 to $22,389.
 The Receipt
The House Is Paid Off. The Tax Never Is.
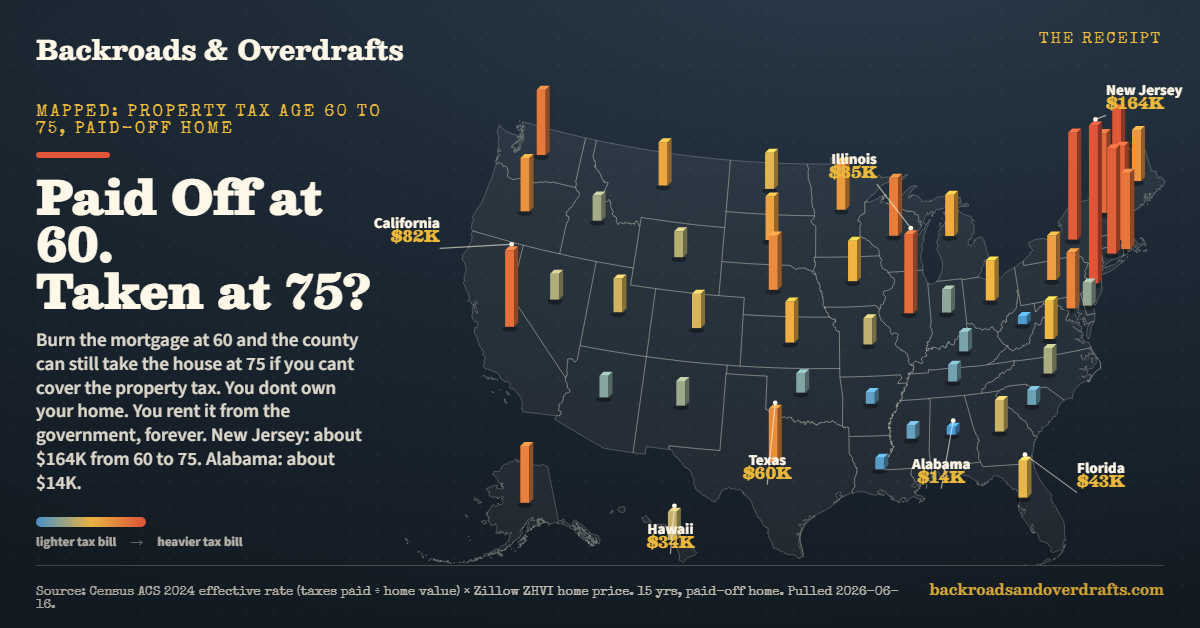
Pay off your mortgage at 60 and the county still bills you every year. We mapped what 15 years of property tax costs on a paid-off home in all 50 states. New Jersey, about $164,000. Alabama, about $14,000.
 The Receipt
Watch Ground Beef Quadruple, and the Steak Dinner Walk Off
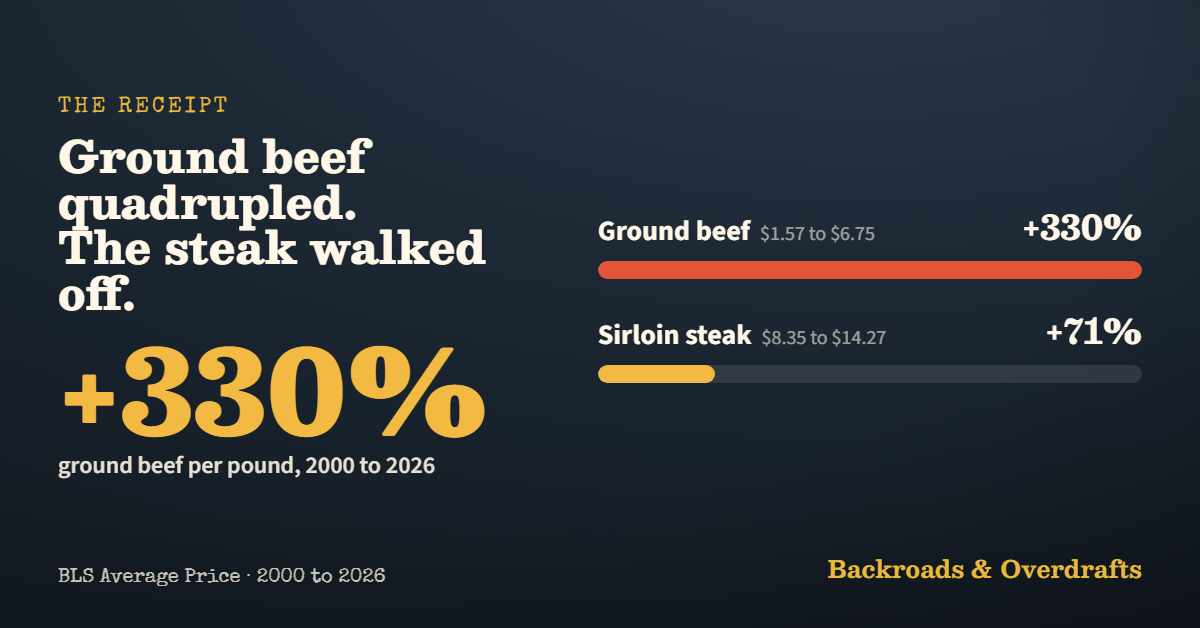
Two animated charts of the meat case. Ground beef went from $1.57 a pound in 2000 to $6.75. The nice steak climbed 71% in just seven years. Here is the run, year by year.