
The Receipt
The House Is Paid Off. The Tax Never Is.
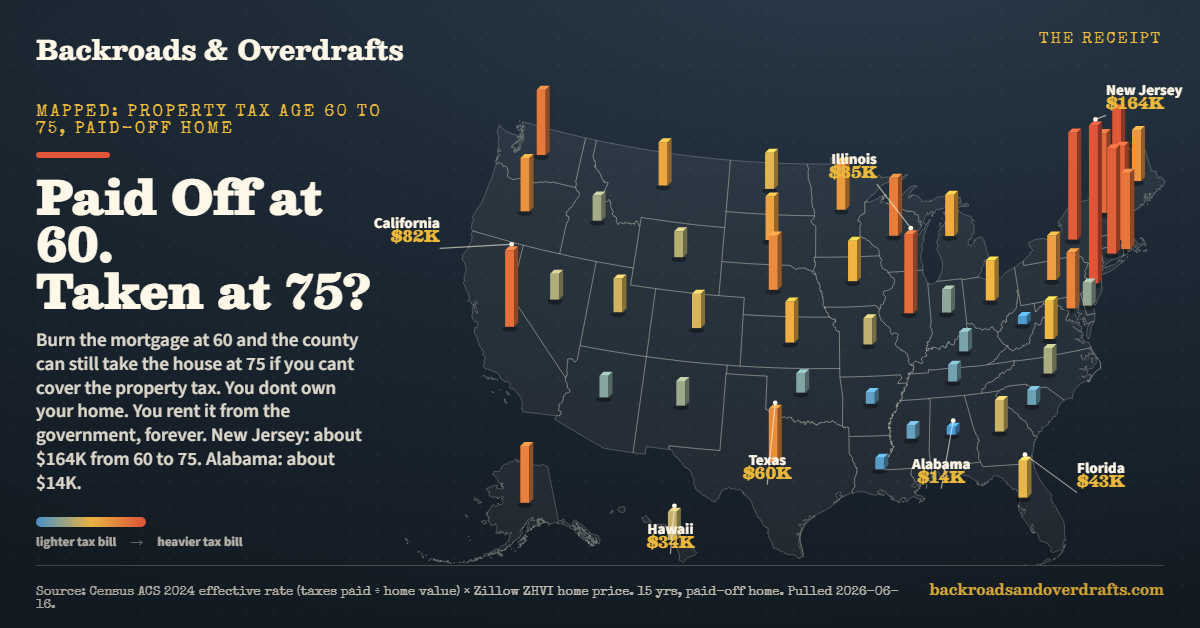
Pay off your mortgage at 60 and the county still bills you every year. We mapped what 15 years of property tax costs on a paid-off home in all 50 states. New Jersey, about $164,000. Alabama, about $14,000.
There is a version of the American dream that ends with a small ceremony at the kitchen table. You make the last mortgage payment somewhere around 60, maybe you frame the statement, and for the first time in 30 years nobody has a claim on the roof over your head. The house is yours. Free and clear.
Except it is not, and most people only learn the fine print the hard way.
The mortgage was the loan. The property tax is the rent you pay the county for as long as you own the place, and it never makes a final payment. Stop paying it long enough and the county can put a lien on the house and, eventually, take it and sell it out from under you. Paid off or not. That is true in all 50 states. There is no deed in America that comes with a finish line on property tax.
So we ran the number nobody puts on the celebration cake: if you own your home outright from 60 to 75, those 15 years you thought you were finally done, what does the county still take?
How we got the number
Two honest pieces, multiplied.
The first is what a typical home is worth in your state, using the Zillow Home Value Index for May 2026. The second is your state’s real property tax rate, not the sticker rate on a tax form but the effective rate: what homeowners there actually pay, calculated from the Census Bureau by dividing the median real estate taxes paid (table B25103) by the median home value (table B25077). Because that figure is taxes people actually paid, it already bakes in the exemptions and caps real homeowners receive.
Multiply the home value by the effective rate and you get one year of property tax. Multiply that by 15 and you get the retirement bill, held flat so the math stays clean. Real values and rates drift, but the spread between states is the story, and that spread is enormous.
Nationally, the typical home runs about $370,000 and the average effective rate is around 0.89 percent. That works out to roughly $49,000 in property tax across those 15 paid-off years. That is the middle of the country. The edges are where it stops feeling abstract.
The states where a paid-off house still costs a fortune
New Jersey is in a category of its own. A typical home there is worth about $579,000, and the effective rate is 1.89 percent, so the owner pays roughly $10,900 a year. Over 15 years that is $163,818 in property tax on a house they already own outright. That is a second down payment, paid to the county, after the mortgage was gone.
The rest of the top of the list is the Northeast almost top to bottom:
| State | Property tax per year | 15 years, paid off |
|---|---|---|
| New Jersey | $10,921 | $163,818 |
| New Hampshire | $7,552 | $113,274 |
| New York | $7,531 | $112,966 |
| Connecticut | $7,410 | $111,152 |
| Massachusetts | $6,679 | $100,189 |
| Illinois | $5,657 | $84,861 |
| California | $5,482 | $82,237 |
The states where it barely registers
Down South the same paid-off house is a rounding error by comparison. Alabama has both the lowest effective rate in the country, 0.38 percent, and one of the smallest bills. A typical Alabama homeowner pays about $914 a year, so 15 retirement years cost $13,706, less than one year in New Jersey.
| State | Property tax per year | 15 years, paid off |
|---|---|---|
| Alabama | $914 | $13,706 |
| West Virginia | $922 | $13,828 |
| Louisiana | $1,150 | $17,251 |
| Arkansas | $1,169 | $17,537 |
| Mississippi | $1,290 | $19,347 |
| South Carolina | $1,375 | $20,628 |
| Tennessee | $1,505 | $22,578 |
Same paid-off house, the same 15 years of retirement, and a roughly 12 to 1 gap between the top and the bottom of the country. The state line on your deed quietly decides whether the forever bill is a minor annoyance or a real strain on a fixed income.
Rate and price pull in opposite directions
The map has a twist worth catching, because the highest tax bill and the highest tax rate are not the same state.
Illinois actually has the steepest effective rate in the country at 1.92 percent, a hair above New Jersey. But Illinois homes are cheaper, so the bill lands at about $85,000 instead of New Jersey’s $164,000. A high rate on a modest house.
California is the mirror image. Its effective rate is a gentle 0.71 percent, thanks largely to the assessment caps in Proposition 13. But the typical California home is worth about $776,000, so even that low rate produces an $82,000 bill. A low rate on an expensive house lands in the same place as a high rate on a cheap one.
Hawaii takes it to the extreme: the lowest rate in the nation at 0.27 percent, attached to the most expensive homes in the country, which nets out to about $34,000. The lesson is that you cannot judge your future bill by the rate alone or the home price alone. You have to multiply them, which is exactly what the map does.
One state is trying to change the rules
Florida is the state to watch. It already has no state income tax, which is why people confuse it for a no-tax haven, but it absolutely charges property tax, about $42,700 over those 15 years on a typical home. What is new is that Florida is the one state actively trying to gut it. Governor DeSantis backed a constitutional amendment, “Save Our Homes from Excessive Property Taxes,” that heads to the November 3, 2026 ballot and needs 60 percent voter approval. Even if it passes it does not zero the bill out: it raises the homestead exemption to $150,000 and then $250,000, and the legislature carved out school taxes, which are close to 40 percent of a typical bill. You can read the current status from CBS Miami’s coverage of the ballot measure. Until something actually passes, the number on the map is the number.
What to actually do with this
If you own or plan to own into retirement, this is not a doom number, it is a planning number. A few moves genuinely change it:
- Claim every exemption you qualify for. Most states offer a homestead exemption on your primary residence, and many add a senior exemption or a “senior freeze” that locks your assessment once you hit a certain age and income. These are not automatic. You usually have to apply through your county assessor, and people leave real money on the table by never filing.
- Ask about a property tax deferral. A number of states let lower-income seniors postpone property taxes until the home is sold or transferred, so a fixed income is not forced to cover a rising bill in real time. The terms vary a lot by state, so confirm with your county.
- Appeal the assessment if it looks high. Your bill is the rate times your home’s assessed value, and assessments are often wrong. If comparable homes nearby are valued lower, an appeal can cut the bill for years, not just once.
- Put the rate on your retirement-state shortlist. People weigh weather, family, and home prices when they pick where to retire and almost never look up the effective property tax rate. On a paid-off house it is one of the largest recurring costs you will carry, and as the map shows, it ranges from trivial to brutal depending on the line you land on.
For the official numbers behind all of this, the Census Bureau’s data tables carry the taxes-paid and home-value figures by state, the Tax Foundation’s property taxes by state is a clean reference on effective rates, and Zillow’s research data is the source for the typical home values.
The caveat
These are statewide typical figures, so your town can run higher or lower, sometimes a lot. The 15-year total holds the home value and the rate flat, which keeps the comparison honest between states but will not match a real bill that rises with reassessments over time. And the Census effective rate is built from taxes people actually paid, which means it already reflects the average homeowner’s exemptions, so your own bill depends on what you qualify for.
But the core fact survives all of it. There is no such thing as a fully paid-off house in America. There is only a house with a smaller, permanent bill, and the size of that bill is decided largely by a border you may have crossed decades ago.
This is the same squeeze we keep finding on every receipt. It is why home prices pulled away from incomes in the first place, why a paycheck stretches so differently from one metro to the next, and why a Social Security raise keeps losing to the grocery bill.
If you could retire anywhere, would the property tax line change where you go?
Source: effective property tax rate from U.S. Census Bureau, American Community Survey 2024 1-year estimates (median real estate taxes paid, table B25103, divided by median home value, table B25077), applied to the Zillow Home Value Index typical home value by state (May 2026). Fifteen-year total = home value x effective rate x 15, held flat. Pulled 2026-06-16.
Keep reading
More from The Receipt
 The Receipt
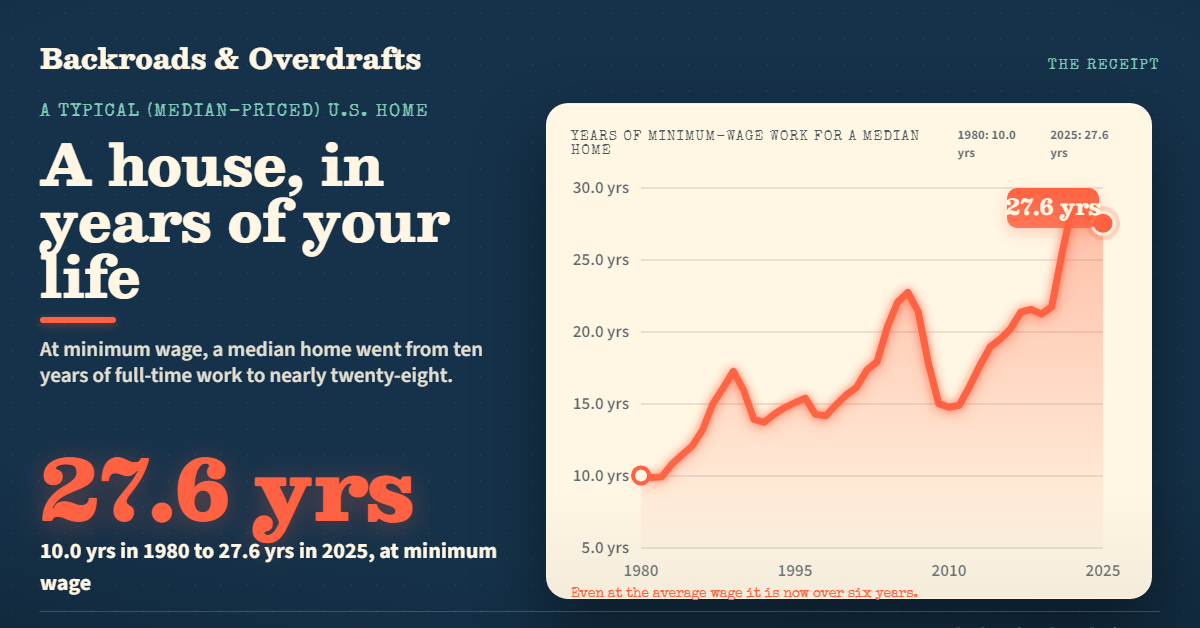
A House Used to Cost 4 Years of Work. Now It Is Closer to 6 and a Half.
Measured in years of full-time work instead of dollars, a typical American home went from about 4.5 years of the average wage in 1980 to 6.4 today, and from 10 years to nearly 28 at minimum wage. The median price climbed from $64,750 to $415,400.
 The Receipt
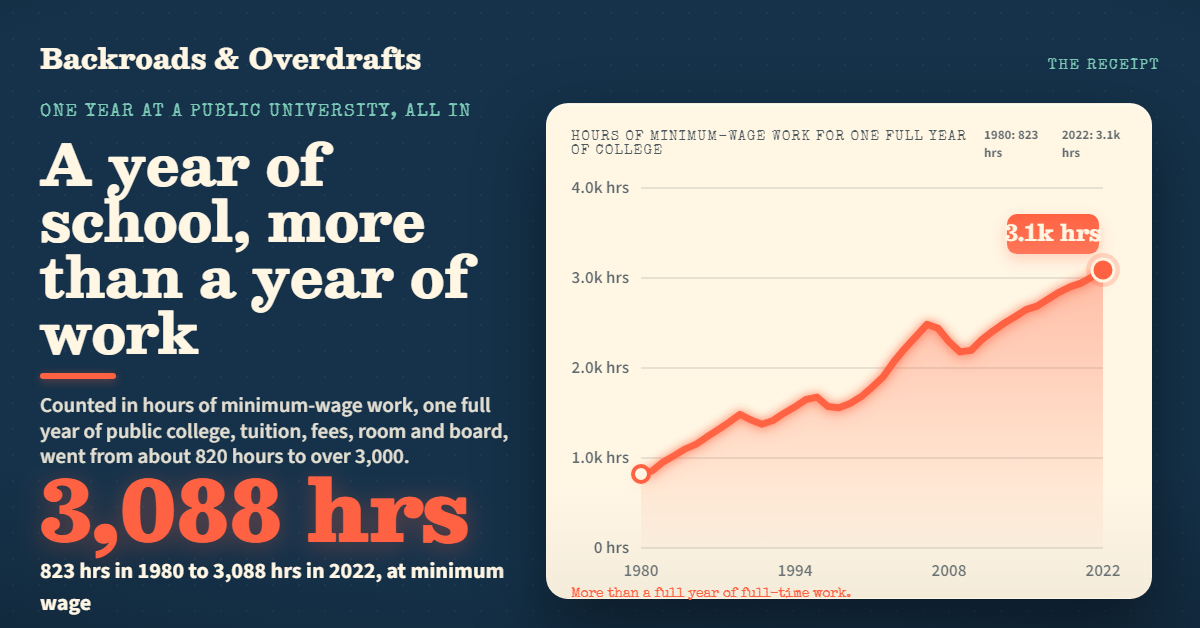
A Year of College Now Costs More Than a Year of Work
Add up everything one year at a public university actually costs, tuition, fees, room and board, and price it in hours of work. It went from about 820 hours of minimum-wage work in 1980 to over 3,000 today. The bill climbed from $2,550 to $22,389.
 The Receipt
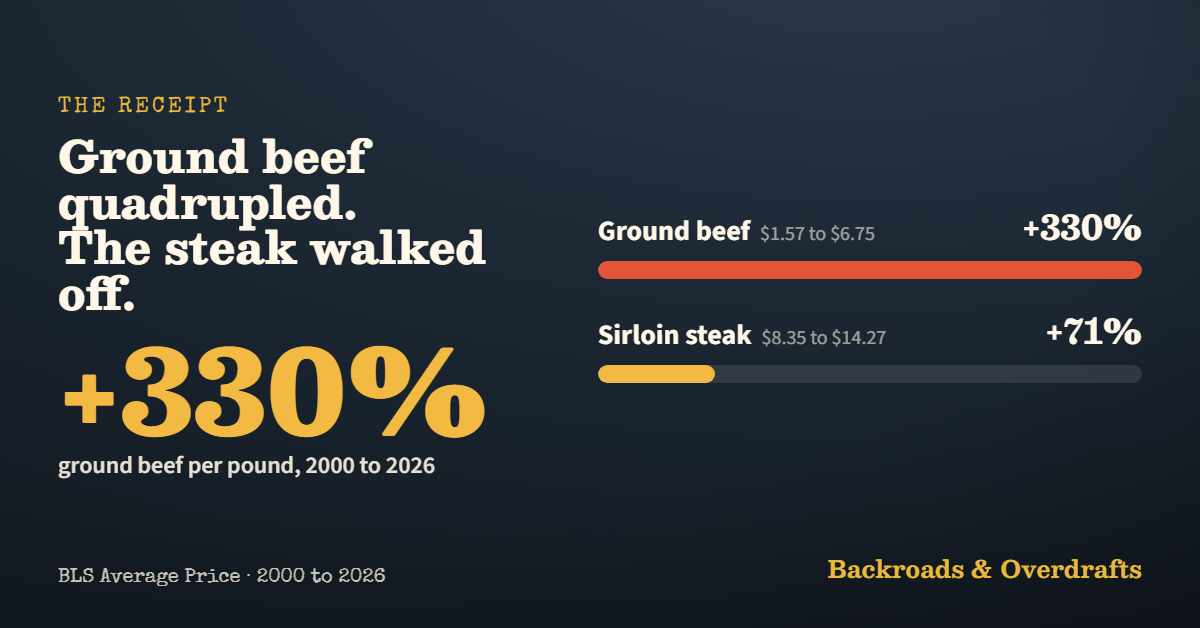
Watch Ground Beef Quadruple, and the Steak Dinner Walk Off
Two animated charts of the meat case. Ground beef went from $1.57 a pound in 2000 to $6.75. The nice steak climbed 71% in just seven years. Here is the run, year by year.