
The Receipt
How the House Got Out of Reach
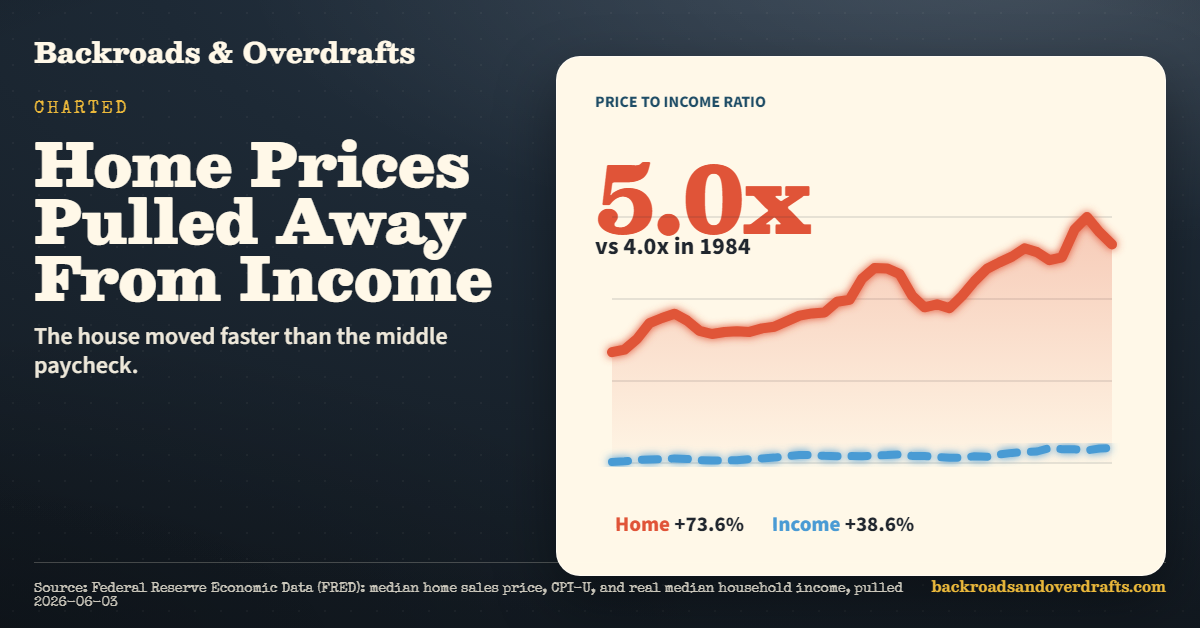
Median home sale prices rose faster than median household income from 1984 to 2024.
There are a lot of ways to measure whether a house feels out of reach. Mortgage rates matter. Property taxes matter. Insurance matters. Down payments matter. Local wages matter. But before any of that, there is one plain question worth asking:
How far did the price of the house move compared with the paycheck?
According to Federal Reserve Economic Data (FRED), in 1984 the median U.S. home sale price was about $241,310 in 2024 dollars. Median household income was about $60,420. That put the home price at roughly 4.0 times the median household income.
By 2024, the median home sale price was about $418,975. Median household income was about $83,730. That put the home price at 5.0 times income.
That is the part people are feeling. Not just “houses got expensive.” The house got farther away from the paycheck.
The receipt
| Year | Home price | Household income | Price / income |
|---|---|---|---|
| 1984 | $241,310 | $60,420 | 4.0x |
| 1990 | $293,631 | $65,440 | 4.5x |
| 2000 | $305,242 | $71,790 | 4.3x |
| 2010 | $320,349 | $68,420 | 4.7x |
| 2020 | $397,673 | $81,580 | 4.9x |
| 2022 | $464,126 | $79,500 | 5.8x |
| 2024 | $418,975 | $83,730 | 5.0x |
The worst point in this dataset was 2022. The median sale price hit about 5.8 times median household income. Prices cooled from that peak, but the 2024 number was still well above where this started.
What changed
From 1984 to 2024:
- Median home sale price rose 73.6% after inflation.
- Median household income rose 38.6% after inflation.
- The home-price-to-income ratio moved from 4.0x to 5.0x.
That does not mean every buyer in 1984 had it easy. It also does not mean every buyer today is doomed. It means the national middle moved. The median house sold pulled farther ahead of the median household income.
The caveat that matters
This chart is not a full monthly-payment chart. It does not include mortgage rates, down payments, property taxes, insurance, repairs, credit standards, or the fact that local markets can look nothing like the national median.
It also uses median sale price of houses sold, not every home in America and not starter homes only. When fewer cheap homes sell, the median sale price can look higher. When local wages lag the national number, the squeeze can feel worse than this chart suggests.
So read this as the first layer of the story. Before the mortgage math, before the insurance bill, before the property-tax notice, the sticker price of the house already outran the middle household income.
That is why the old advice can sound so strange now. “Just save up and buy a house” lands differently when the house has moved farther from the paycheck.
The part the chart cannot show
The chart compares national home prices with national household income. That is useful, but it is still the clean version of a messy life.
A first-time buyer also has to clear the cash hurdles that do not show up in a simple price-to-income chart:
- Down payment cash, even when the loan allows a low percentage.
- Closing costs, inspections, moving costs, and the first round of repairs.
- Property taxes and insurance, which can change the monthly payment after the offer looks possible.
- Interest rates, which decide how much house the same income can carry.
So when someone says “my parents bought a house on one income,” the useful answer is not a fight about discipline. The structure changed: price, income, financing, and cash-up-front all moved at once.
Useful source trail: the named entities are FRED series for median sales price, CPI-U, and real median household income. FRED’s public economic database starts at fred.stlouisfed.org.
Keep going
If this price check hit the same nerve as your last grocery run, A Bag of Starbucks Costs How Much Now? keeps the receipt math going.
For a cheaper table-level fix, How Your Coffee Quietly Doubled turns the same pressure into dinner.
And when you want a break from the numbers, What Really Happened to Egg Prices is the kind of small outing that still works.
Sources: FRED series MSPUS, CPIAUCSL, and MEHOINUSA672N. Home prices are annual averages of quarterly median sales prices, inflation-adjusted to 2024 dollars with CPI-U. Household income is FRED real median household income. Pulled and verified 2026-06-03.
Keep reading
More from The Receipt
 The Receipt
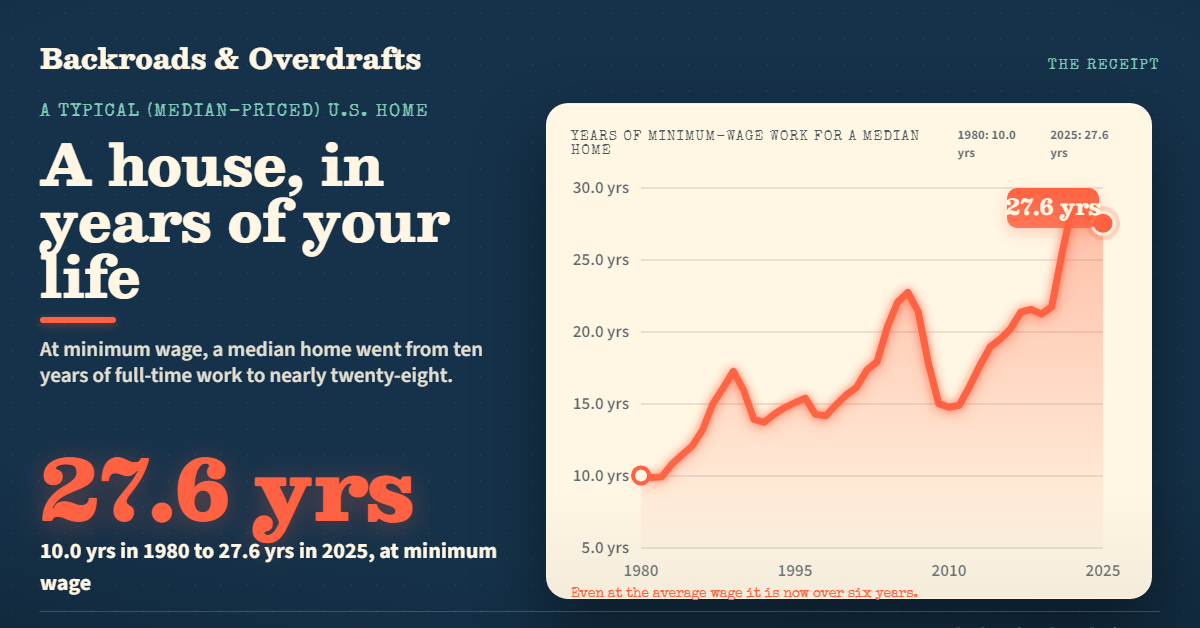
A House Used to Cost 4 Years of Work. Now It Is Closer to 6 and a Half.
Measured in years of full-time work instead of dollars, a typical American home went from about 4.5 years of the average wage in 1980 to 6.4 today, and from 10 years to nearly 28 at minimum wage. The median price climbed from $64,750 to $415,400.
 The Receipt
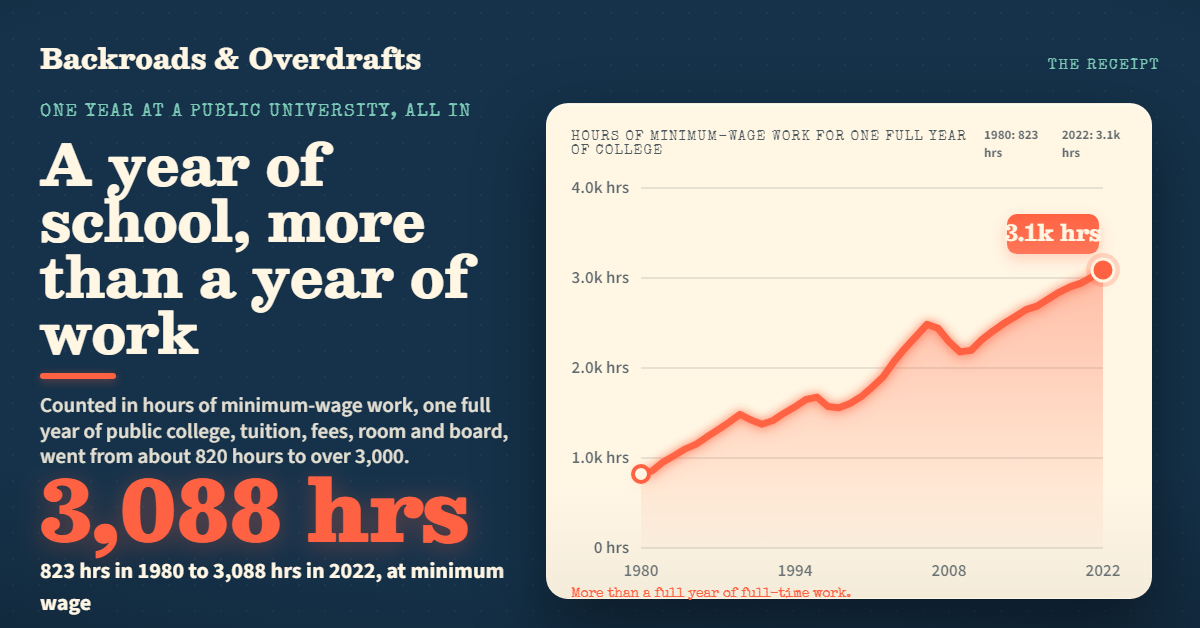
A Year of College Now Costs More Than a Year of Work
Add up everything one year at a public university actually costs, tuition, fees, room and board, and price it in hours of work. It went from about 820 hours of minimum-wage work in 1980 to over 3,000 today. The bill climbed from $2,550 to $22,389.
 The Receipt
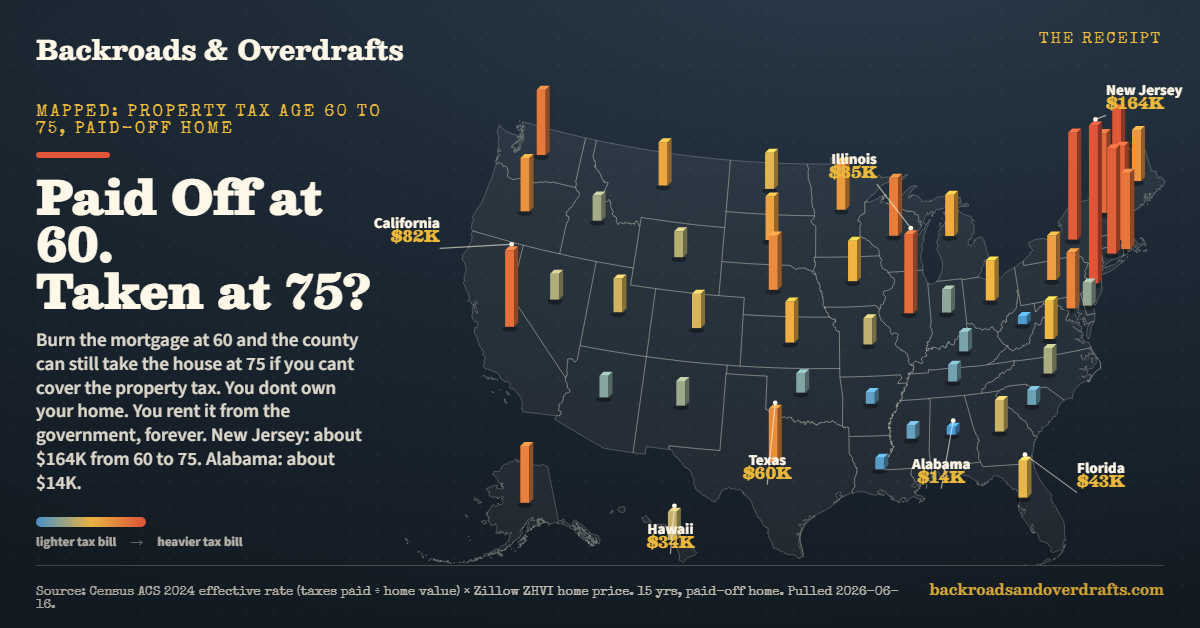
The House Is Paid Off. The Tax Never Is.
Pay off your mortgage at 60 and the county still bills you every year. We mapped what 15 years of property tax costs on a paid-off home in all 50 states. New Jersey, about $164,000. Alabama, about $14,000.