
The Receipt
What 45 Years Did to the Grocery Cart
Twelve everyday groceries tracked with real BLS prices from 1980 to 2026.
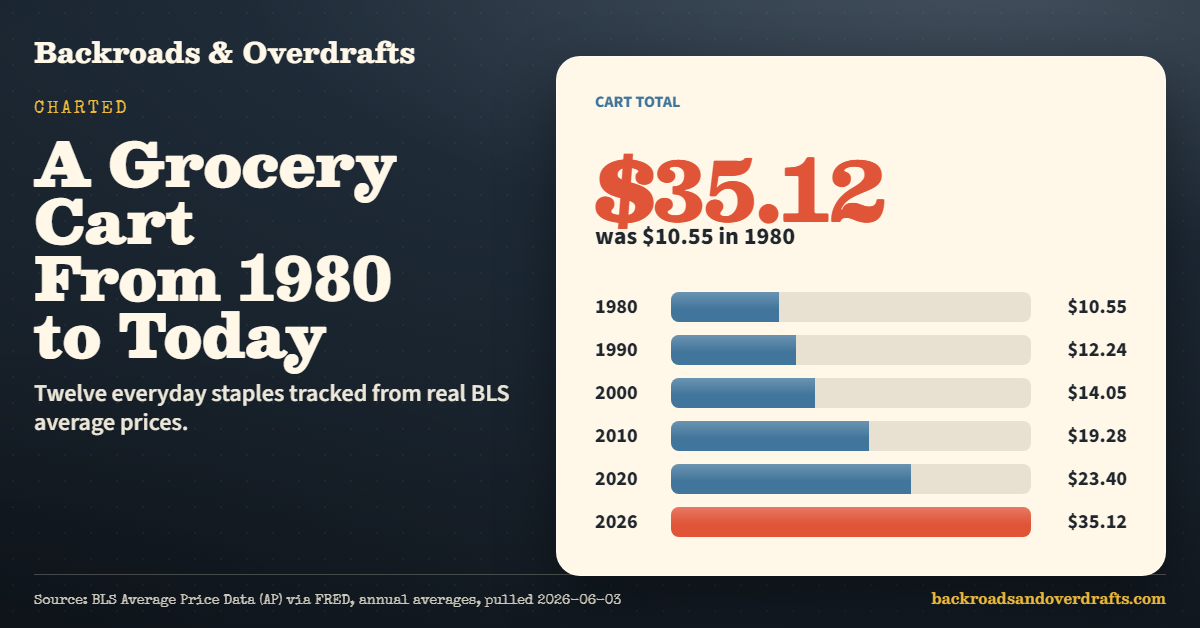
I built one grocery cart, twelve things most of us put in the basket without thinking, and followed the price tag year by year from 1980 to today. Same cart the whole way. Watch the total climb.
The twelve items in the cart: a dozen eggs, a pound of ground chuck, a whole chicken, bacon, white bread, flour, white sugar, white potatoes, ground coffee, bananas, navel oranges, and white rice.
One quick note on these numbers, because it matters. They are U.S. Bureau of Labor Statistics (BLS) national average prices, which blend every brand and every store together, name brand and store brand alike. That is not any single brand, and it is nowhere near what your corner store charges on a bad week. It is the national middle, everything averaged into one figure. Later on we will set real name-brand prices from an actual store right next to it, which is where this gets fun.
In 1980, one of each of these twelve staples ran about $10.55. Today the same cart is $35.12, more than triple. That is the number that makes you set the receipt down for a second.
What surprised me is the honest part. Over those same 45 years, overall inflation rose 299%. This grocery cart rose 233%. So food, as a whole, actually went up a little slower than the cost of everything else. The pain at the register is real. It just is not groceries singling you out.
The cart, decade by decade
| Year | Cost of the cart |
|---|---|
| 1980 | $10.55 |
| 1990 | $12.24 |
| 2000 | $14.05 |
| 2010 | $19.28 |
| 2020 | $23.40 |
| 2026 | $35.12 |
Notice where it really takes off. The cart sat under $15 for two full decades, then added most of its climb after 2010.
Now measure it in hours of work, not dollars
Dollars only tell you half of it, because your paycheck moved too. So I did the math a second way: how many minutes you have to work, at the average hourly wage, to afford the whole cart.
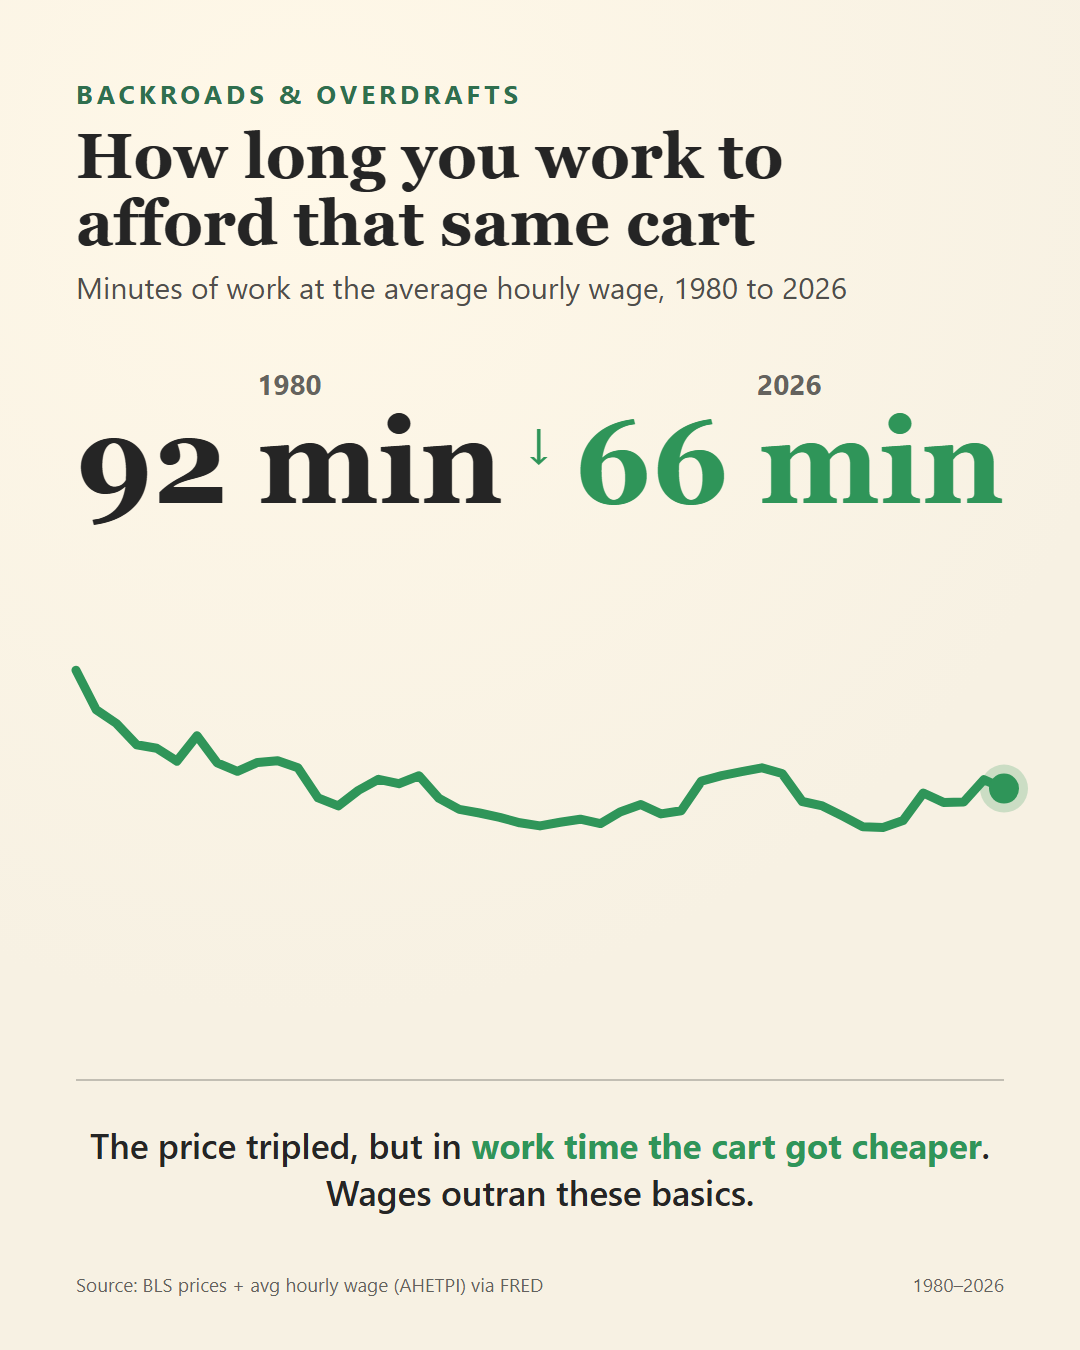
In 1980, that cart cost you about 92 minutes of work. Today it costs about 66 minutes. Even though the price more than tripled, in work time the cart actually got cheaper, because wages climbed faster than these particular groceries. It bottomed out near 57 minutes around 2020, then the recent price surge pushed it back up. That last jump is the part everyone is feeling right now, and it is real, but the longer view is kinder than the sticker price suggests.
A few of the twelve, then and now, for the people who like the receipts:
- A dozen eggs: $0.84 to $2.42
- A pound of ground chuck: $1.83 to $6.75
- A pound of bacon: $1.47 to $6.88, the worst offender in the cart
- A pound of coffee: $3.14 to $9.54
- A loaf of bread: $0.51 to $1.84
Useful source trail: the historical cart uses BLS Average Price Data and FRED-hosted wage series. Start with BLS CPI data for the public data doorway and FRED for economic time series.
What it actually costs at a real store, today
National averages are useful for the long view, but nobody shops at the national average. So I pulled live name-brand prices from two real Kroger-family stores: a Ralphs in west Los Angeles, and a Kroger in Morgantown, West Virginia. Same name brands, same package sizes, same day.
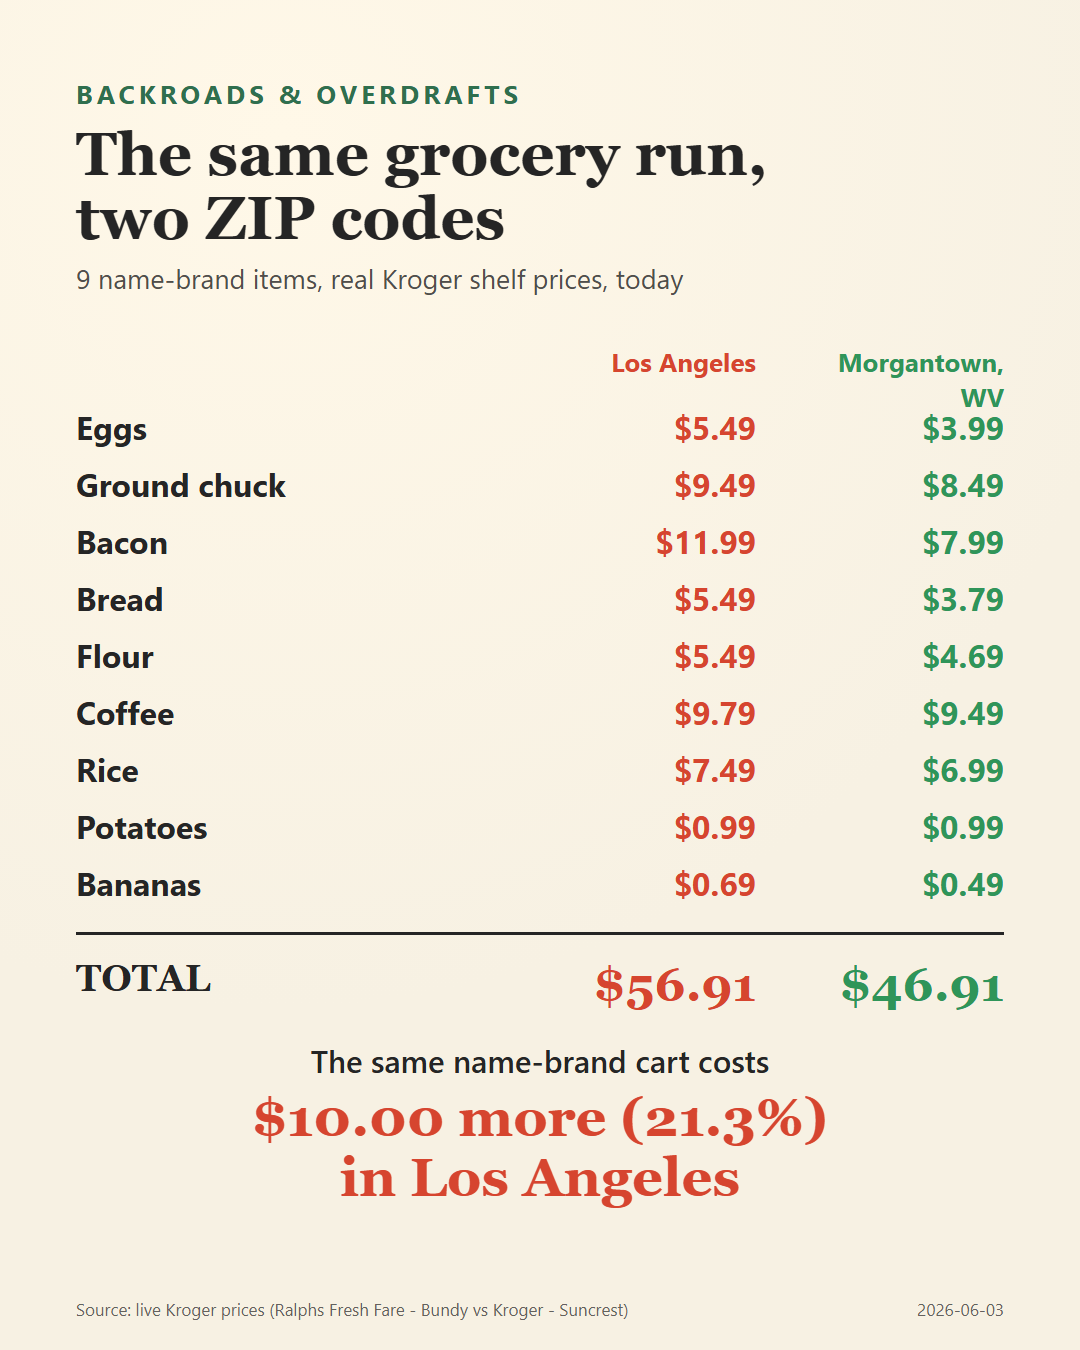
The same nine name-brand items came to $56.91 in Los Angeles and $46.91 in Morgantown. That is ten dollars, about 21% more, for the exact same groceries, just a different ZIP code. Eggs alone were $5.49 in LA against $3.99 in West Virginia.
Three more items are not in that matched total, because the brand or the package size differs by region: whole chicken, sugar, and oranges. For what it is worth, each one was cheaper in Morgantown too.
The cart audit worth saving
If you want to use this idea on your own groceries, keep it small. Pick five items your household buys all the time and track the unit price for a month.
| Item type | Best unit | Why |
|---|---|---|
| Meat | Price per pound | Package sizes change constantly. |
| Cereal, rice, pasta | Price per ounce | Boxes shrink quietly. |
| Eggs | Price per dozen | The unit stays easy to compare. |
| Coffee | Price per pound or cup | Bag size and brew method both matter. |
One month will teach you more than a stack of vague inflation takes.
A few honest caveats
The historical figures are national average city prices, not your local shelf, and they are annual averages that smooth out the week-to-week swings. The cart starts in 1980 because that is the first year all twelve items have real BLS data. Nothing here is estimated or inflation-adjusted to fill a gap; every figure is a number that BLS, FRED, or a live Kroger store actually recorded. The two-store comparison is a snapshot from one day, and prices move.
So there it is, three different ways to look at the same cart. What is the one thing in your kitchen that has gone up the most since you started keeping house?
Keep going
If this price check hit the same nerve as your last grocery run, A Bag of Starbucks Costs How Much Now? keeps the receipt math going.
For a cheaper table-level fix, How the House Got Out of Reach turns the same pressure into dinner.
And when you want a break from the numbers, How Your Coffee Quietly Doubled is the kind of small outing that still works.
Sources: U.S. Bureau of Labor Statistics Average Price Data and average hourly wage (AHETPI) via FRED, 1980 to 2026 (national city averages). Plus live Kroger-family shelf prices pulled 2026-06-03. Pulled and verified 2026-06-03.
Keep reading
More from The Receipt
 The Receipt
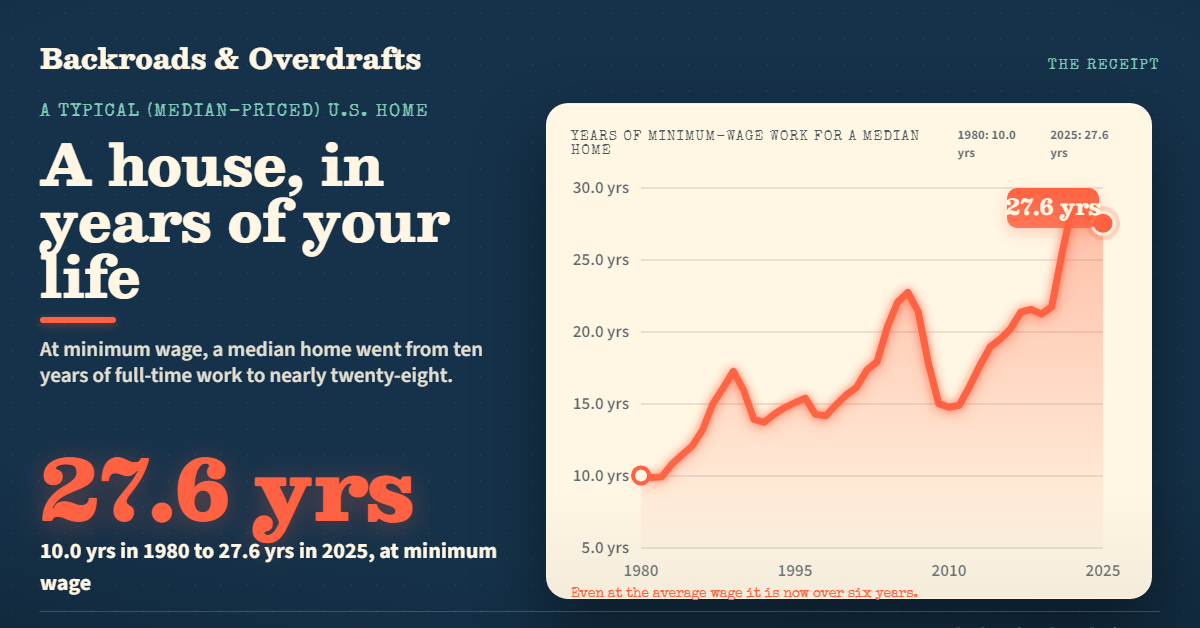
A House Used to Cost 4 Years of Work. Now It Is Closer to 6 and a Half.
Measured in years of full-time work instead of dollars, a typical American home went from about 4.5 years of the average wage in 1980 to 6.4 today, and from 10 years to nearly 28 at minimum wage. The median price climbed from $64,750 to $415,400.
 The Receipt
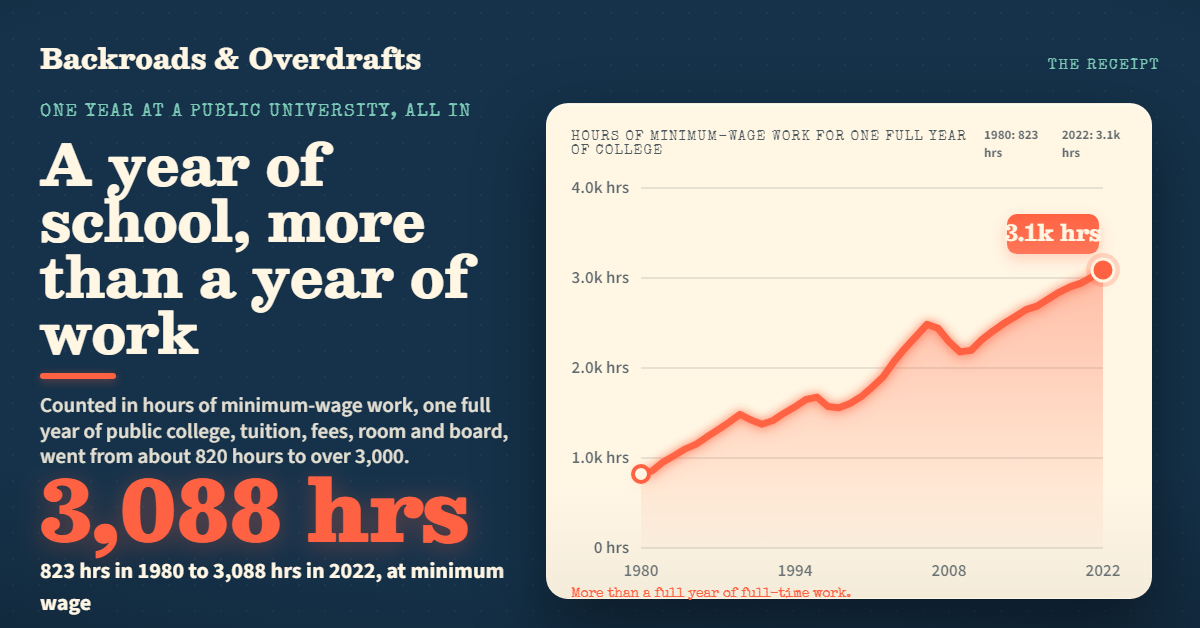
A Year of College Now Costs More Than a Year of Work
Add up everything one year at a public university actually costs, tuition, fees, room and board, and price it in hours of work. It went from about 820 hours of minimum-wage work in 1980 to over 3,000 today. The bill climbed from $2,550 to $22,389.
 The Receipt
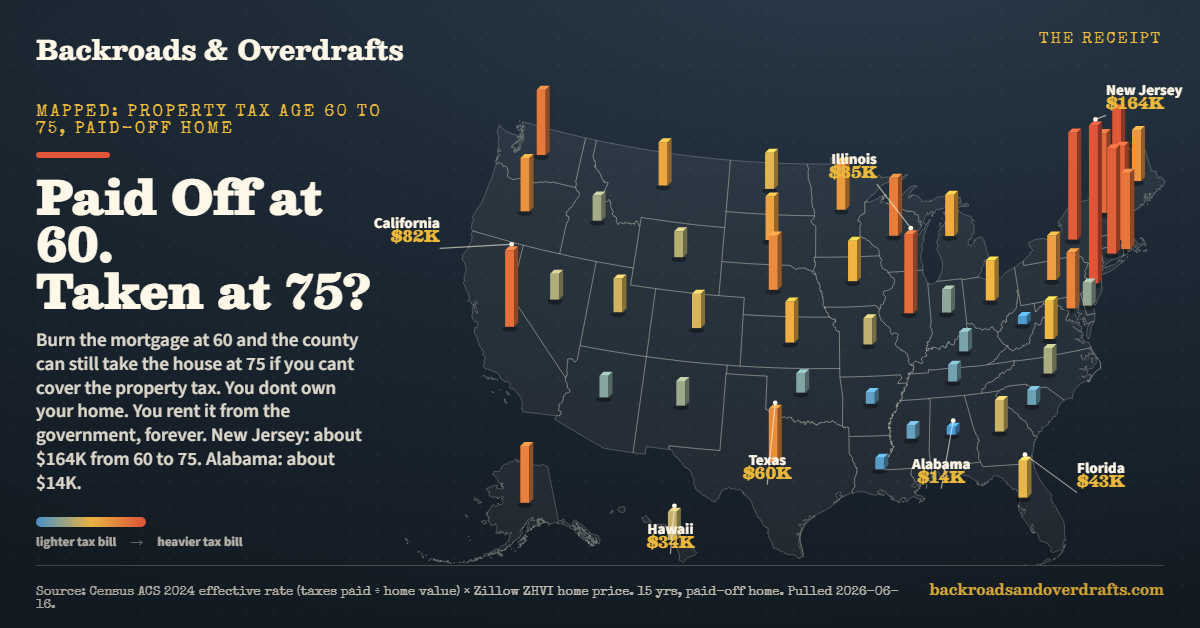
The House Is Paid Off. The Tax Never Is.
Pay off your mortgage at 60 and the county still bills you every year. We mapped what 15 years of property tax costs on a paid-off home in all 50 states. New Jersey, about $164,000. Alabama, about $14,000.